Introduction
In this essay, I show the very basics of transpiling a diagram to code.
I call this DaS - Diagrams as Syntax.
If you want to follow along, see Appendix - Getting Started.
There's nothing new here - just a combination of already-existing technologies.
This should look ridiculously simple.
You should find yourself yawning through most of this.
If it doesn't seem simple enough, I haven't done my job well.
I am happy to answer questions.
[If you are reading the .md form of this essay, then see also, https://guitarvydas.github.io/2021/01/12/Transpiling-Diagrams-to-Code-101.html, or the .pdf form of this essay]
A Simple Diagram
See simple.drawio.
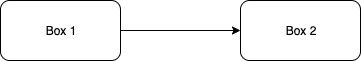
We see a very simple diagram on Tab 101.
The diagram consists of two boxes, joined by an arrow.
We will:
- convert this diagram to text, from .drawio to .xml format
- convert the .XML to a JavaScript object
- extract the interesting stuff from the object, and leave the rest behind ("syntactic noise")
- normalize the interesting stuff into a factbase
- normalize the graphics - glean bounding boxes for every box
- stop (that's enough for lesson 101).
We will do a lot of this manually.
We can do all of this with just a text editor.
I will suggest technologies (from direct experience) that automate the boring, repetitive edits. My goal is to automate everything and not to have to use an editor.
Transpilation
Convert the Diagram to Text
Load the diagram simple.drawio into a programmers' text editor.
You should see a header (mxfile host="Electron"…) followed by at least one <diagram>…</diagram> in compressed form.
Copy the compressed stuff inside of the <diagram> element (zZRNT…A==) and paste it into the drawio diagram decoder https://jgraph.github.io/drawio-tools/tools/convert.html.
Hit the decode button (at the bottom).
You should see human-readable XML, e.g. <mxGraphModel … > … </mxGraphModel>.
Copy the XML and paste it into a local file.
I saved my copy in decoded.xml.
Further reading:
https://drawio-app.com/extracting-the-xml-from-mxfiles/
https://jgraph.github.io/mxgraph/docs/manual.html
Convert XML to JS
The XML for our diagram is contained in the <root>…</root> element.
<mxCell id="0"/>
<mxCell id="1" parent="0"/>
<mxCell id="irZAPYOEPGDIWvvxZr80-1" style="edgeStyle=orthogonalEdgeStyle;rounded=0;orthogonalLoop=1;jettySize=auto;html=1;exitX=1;exitY=0.5;exitDx=0;exitDy=0;entryX=0;entryY=0.5;entryDx=0;entryDy=0;" parent="1" source="irZAPYOEPGDIWvvxZr80-2" target="irZAPYOEPGDIWvvxZr80-3" edge="1">
<mxGeometry relative="1" as="geometry"/>
</mxCell>
<mxCell id="irZAPYOEPGDIWvvxZr80-2" value="Box 1" style="rounded=1;whiteSpace=wrap;html=1;align=center;" parent="1" vertex="1">
<mxGeometry x="40" y="120" width="120" height="60" as="geometry"/>
</mxCell>
<mxCell id="irZAPYOEPGDIWvvxZr80-3" value="Box 2" style="rounded=1;whiteSpace=wrap;html=1;align=center;" parent="1" vertex="1">
<mxGeometry x="280" y="120" width="120" height="60" as="geometry"/>
</mxCell>
This can be converted using an editor (yawn), into Javascript:
const graphModel =
{ element: "mxGraphModel",
attributes: {
dx: 940,
dy: 670,
grid: 1,
gridSize: 10,
guides: 1,
tooltips: 1,
connect: 1,
arrows: 1,
fold: 1,
page: 1,
pageScale: 1,
pageWidth: 1100,
pageHeight: 850,
math: 0,
shadow: 0
},
content:
[
{ element: "root",
attributes: [],
content: [
{
element: "mxCell",
attributes: { 'id', "yqBiCKyfxECIX-FCSyxT-0" },
content: []
},
{
element: "mxCell",
attributes: { id: "yqBiCKyfxECIX-FCSyxT-1", parent: "yqBiCKyfxECIX-FCSyxT-0" },
content: []
},
{
element: "mxCell",
attributes: {id: "yqBiCKyfxECIX-FCSyxT-4", style: "edgeStyle=orthogonalEdgeStyle;rounded=0;orthogonalLoop=1;jettySize=auto;html=1;exitX=1;exitY=0.5;exitDx=0;exitDy=0;entryX=0;entryY=0.5;entryDx=0;entryDy=0;", edge: "1", parent: "yqBiCKyfxECIX-FCSyxT-1", source: "yqBiCKyfxECIX-FCSyxT-2", target: "yqBiCKyfxECIX-FCSyxT-3" },
content: [ { element: "mxGeometry", attributes: {relative: "1", as: "geometry" }, content: []} ]
},
{
element : "mxCell",
attributes: {id: "yqBiCKyfxECIX-FCSyxT-2", value: "Box 1", style: "rounded=1;whiteSpace=wrap;html=1;align=center;", vertex: "1", parent: "yqBiCKyfxECIX-FCSyxT-1"},
content: [ { element: "mxGeometry", attributes: {x: "40", y: "120", width: "120", height: "60", as: "geometry"}, content: [] } ]
},
{
element: "mxCell",
attributes: {id: "yqBiCKyfxECIX-FCSyxT-3", value: "Box 2", style: "rounded=1;whiteSpace=wrap;html=1;align=center;", vertex: "1", parent: "yqBiCKyfxECIX-FCSyxT-1"},
content: [ { element: "mxGeometry", attributes: {x: "280", y: "120", width: "120", height: "60", as: "geometry"}, content: [] } ]
}
]
}
]
};
I stored the converted file in graphmodel.js.
Further reading:
The conversion from XML to JS can be done automatically (e.g. essay 201).
This looks like a job for REGEXP, but it isn't.
REGEXP creates a finite automata, but we need a pushdown finite automata.
This is a job for [rip open shirt:] PEG - Parsing Expression Grammars.
Don't worry about the fancy name - this stuff is as simple to use as REGEXP, but better.
We should be able to write a grammar (pattern match) for the mxGraphModel XML and a set of semantics (i.e. code) that returns a Javascript object.
There are a lot of implementations of PEG for various languages. I happen to use Ohm-js when I use Javascript and ESRAP when I use Common Lisp. REBOL's parse is PEG-like.
Interesting Stuff
The graph model contains mostly 2D graphics information.
We can skip most of it.
We just want to know what the boxes are and what the arrows are.
We want to know where the boxes and arrows are.
We want to know what boxes are connected by arrows. The source box and the target box.
We, probably, want to remember the parent/child relationships of these graphical entities.
Note that we are discussing DaS (diagrams as syntax).
Many people confabulate the notion of visual programming with understanding pixels.
We don't want to go as deep. We don't care about pixels.
We only want to add a few items to our grab-bag - boxes, arrows, text.
We will want to store this "want to know" stuff in some sort of data thingie - a database, a data structure, or something even easier.
I favour the idea of factbases instead of using heavy-weight concepts like databases and data structures.
I will diverge, momentarily, on a discussion of factbases.
Factbases
The trick to automating anything in software is to find a way to normalize the information.
We discovered how to normalize code very early on - we used a notation called assembler.
Assembler is code represented as triples - relation, subject, object.
For example
MOV R0, R1
is a triple. The relation is MOV. The subject is R0. The object is R1.
If the idea of triples sounds familiar, it's because you've already heard of it.
XML is triples[1]. The Semantic Web is triples.
So, what is the normalized format of data?
Triples!
We want to put data into the form: relation, subject, object.
Conveniently, this already exists. It is a function of two parameters:
relation(subject,object);
or,
fn(id,x);
Why is this a Good Thing?
Well, because we impose no structure on the data.
If the data has no structure, then it is easy to parse (in an automatic manner).
If the data has no structure, then it can be used for other kinds of things. Things that the original programmer never thought of.
Note that organizing data into a data structure at compile time is just an optimization. In the 1950's, it seemed like a good idea to preserve CPU power by pre-compiling data into data structures.
Today, CPUs are cheap and abundant, we can waste CPU time building data structures at runtime. We don't have to worry about pre-compiling things.
How shall we waste CPU time?
By performing exhaustive search.
By using backtracking. Backtracking was verbotten in the 1900's, but no more.
I know, from experience, that I will be using PROLOG for doing exhaustive search. So, I will put a period ('.') at the end of each function and call this a fact.
fn(id,x).
Caution: use the principles of Shuhari here.
Shu: don't expand the definition of "x" in the above. It is one thing and one thing only.
For example, imagine that I have a rectangle R, with top-left (x,y) and a width, w, and a height, h.
In factbase notation, this becomes
rectangle(R,nil).
top_x(R,x).
top_y(R,y).
width(R,w).
height(R,h).
Resist the urge to do something like:
rectangle(R,[x,y,w,h]).
or
rectangle(R,nil).
top(R,[x,y]).
wh(R,[w,h]).
We will use CPU power[2] to glean various relationships about the data. In fact, one of the first relationships will be to create a bounding box for each rectangle (we will see this later).
CPU power is cheap.
Memory is cheap.
Don't waste brain power.
Don't try to predict the various ways in which data will be structured.[3]
PROLOG already knows how to deal with triples of the above form.
PROLOG knows how to search triples.
You know how to search triples (loops within loops within …).
It gets boring after a while.
When it gets boring, automate.
Automation done before you know what you're doing is called premature optimization.
You can't know what you're doing unless you've done it manually several times[4].
Corollary: premature optimization happens in anything that is built before the 3rd version.
Thinking is hard, code is cheap.
Experience is hard, code is cheap.
It is best to grow the factbase with new facts, rather than culling facts from the factbase. This allows maximum flexibility during design. Culling is just an optimization and should be left to Optimization Engineering.
Recap:
Code is normalized into triples, e.g. MOV R0,R1.
Data is normalized into triples, e.g. top_x(R,x).
Factbases are the normalized (triple-ified) form of data.
Further Reading:
see the Appendix for tools like gprolog, JS prolog, miniKanren, AWK.
Normalize - Create a Factbase
Now that we know what a factbase is, we will see it in action.
Yawn.
Look at main.js. It contains the following code:
…
createParentFact (element);
createNameFact (element);
createArrowFact (element);
createRectFact (element);
…
It appears that we are interested in only 4 things - and we throw away the rest of the graphical details. [Later, we will deal with text inside of boxes and stuff like that.]
We need to write a bit of - very easy - JS code to extract the interesting information.
We can look at the file facts.js to see how I chose to implement the extraction. YMMV.[5] Yawn.
Bounding Boxes
Now, we want to do something with the factbase and the graphical items.
We want to do as little as possible.
Then, we want to wrap and isolate that bit and never have to think about it again.[6]
The first step in transpiling a diagram is to normalize all of the data. This will allow us to create more-and-more interesting interpretations of the data.
I have put the factbase into a form that is acceptable to PROLOG. YMMV. I use PROLOG to do exhaustive searches. You might want to use something else, like miniKanren (core.logic in Clojure-speak) or just loops within loops in your favourite language.
[I have created a PROLOG for Javascript using Nils Holm's Prolog Control In 6 Slides". See the appendix. This was an exercise in transpiling from one language to another using PEG - Scheme to JS using ohm-js.].
My exhaustive search, written in gprolog, is:
% calculate_bounding_boxes :-
bb(ID,Left,Top,Right,Bottom) :-
x(ID, X),
y(ID, Y),
width(ID,W),
height(ID,H),
Left is X,
Top is Y,
Right is X + W,
Bottom is Y + H.
In Prolog, identifiers that begin with a capital letter are "logic variables" - basically holes that get filled in by the exhaustive search engine. Everything else begins with a lower-case letter. I could have cut out half of the code, but I wanted to be excruciatingly clear.
This says:
match any ID that has an X value
and
has a Y value
and
has a width value
and
has a height value
then
calculate the Left/Top/Right/Bottom values of the bounding box and leave these values in the logic variables Left, Top, Right and Bottom.
Clearly, we could have done this using Loops (recursion) in our favourite language, but the code would not have been so concise.
Another PROLOG file - main.pl - uses the forall function of PROLOG to perform the search over-and-over again and performs the magic incantations to output the results as new facts for the factbase.
Specifically, the new facts are poured out into stderr where the new facts are glued onto the input factbase as the result.[7]
Stop
I will stop "Transpiling Diagrams to Code 101" here.
I will expand, later.
I hope that the basics have been easy to understand and to riff on, after one goes beyond the Shu and Ha phases of Shuhari.
There's nothing new here - just a combination of already-existing technologies.
Appendix - Getting Started
1. Get the code https://github.com/guitarvydas/transpiling-diagrams
2. git checkout 101
3. See the essay in "Transpiling Diagrams to Code 101.md/Transpiling Diagrams to Code 101.md".
4. Get Ohm-js from https://github.com/harc/ohm and put a copy of ohm.js alongside of this code, or, better see https://guitarvydas.github.io/2021/01/12/Transpiling-Diagrams-to-Code-101.html or the .pdf form of this essay.
5. Examine and run run.bash.
[If you are reading the .md form of this essay, , see https://guitarvydas.github.io/2021/01/12/Transpiling-Diagrams-to-Code-101.html or the .pdf form of this essay.]
Appendix - Automation
Decoding DRAWIO Files
The code for the decoder is: https://github.com/jgraph/drawio-tools.
We should be able to decode .drawio files using Javascript.
At time of writing, I haven't figured out how to do this using, say, node.js. Suggestions welcome.
Converting mxGraphModel to JavaScript
Use PEG to pattern-match the xml and then emit it (a semantic action)[8] as Javascript.
I expect to write about this transformation step in later essays.
Appendix - Tools
PEG - Ohm In Small Steps
Everyone knows how to use REGEXP.
PEG is better than REGEXP.
Use PEG instead of REGEXP.
https://computingsimplicity.neocities.org/blogs/OhmInSmallSteps.pdf
https://guitarvydas.github.io/2020/12/09/OhmInSmallSteps.html
(the HTML version doesn't have page numbers.)
PEG
https://bford.info/pub/lang/peg/
Ohm-js: (PEG for Javascript)
ESRAP: (PEG for Common Lisp)
https://github.com/scymtym/esrap
GProlog
PROLOG ain't scary.
PROLOG is just a pattern matcher.
PROLOG has a convenient syntax for pattern matching. Identifiers that begin with an upper-case letter are "logic variables" - i.e. match-capturing doo-dads. Everything else begins with lower-case letters.
REGEXP uses a horrible syntax for match-capturing - e.g. '\(…\)'. PROLOG uses a less-horrible syntax for this.
REGEXP works on characters. PROLOG works on higher-level things.
PROLOG becomes scary if you try to use it for everything. A single paradigm does not suit all problems, nor all parts of a problem. Get into the habit of using many paradigms for a single solution[9]. Get into the habit of building many little languages for a single solution. (I call these SCLs - Solution Centric Languages. SCLs are like DSLs, but more focussed and less hassle to build (if you use PEGs)).
JS Prolog
https://github.com/guitarvydas/js-match
https://github.com/guitarvydas/js-prolog
miniKanren
(In Clojure, this is called core.logic).
AWK
https://en.wikipedia.org/wiki/AWK
https://www.gnu.org/software/gawk/manual/gawk.html
I first used AWK to build a peephole optimizer for a C compiler I wrote (around 1980/1981).
The C code produced normalized code - aka assembler.
Nils Holm PROLOG
https://www.t3x.org/bits/prolog6.html
I used Nils' Scheme code and converted it into Javascript using PEG (ohm-js).
Appendix - Documentation
Drawio decoder:
https://drawio-app.com/extracting-the-xml-from-mxfiles/
MxGraph User Manual:
https://jgraph.github.io/mxgraph/docs/manual.html
[1] XML has too much syntax to be easily readable.
[2] exhaustive search
[3] Only tyrants tell you what to think. Be free. Let others be free.
[4] Fred Brooks says that you need to build something 2 times (and throw the results away). Then, knowing what you are doing, you build it a 3rd time.
[5] YMMV means Your Mileage Might Vary. It means this even in metric countries.
[6] That's called The Principle of Superposition.
Superposition is taught in other Engineering disciplines. I learned about it in EE school, tangled up with Kirchoff's Laws. Superposition makes EE a lot easier to design, even though everything in a circuit is concurrent. The last time I saw Superposition at work in software was when I looked at a bash script.
[7] Obviously, we could use a language that helped us add facts to the input factbase. I haven't figured out how to do this easily in PROLOG. But, why would I care? I can leave the cleanup to someone who specializes in Maintenance Engineering. [I have figured out how to do this not-so-easily in PROLOG, but it ain't pretty, see https://github.com/bmfbp/bmfbp].
[8] Semantic action is just a fancy word that you may ignore. In ohm-js, a semantic action is a lump of Javascript that where pattern-matching-capture is passed in as function parameters.
[9] Lispers "get" this idea. That's why they love Lisp and the freedom of thought that it brings. Javascript comes close (first-class functions, dynamic typing). Static typing is just a DSL that uses dynamic typing and pushes all of the interpretation of types to the so-called "compile time". "Compile time" is an arbitrary concept (e.g. loaders finalize code at the beginning of runtime, even when static typing is used).