Goal
The Goal of this step is to enter the diagrams manually.
Ideally, we would use an editor to perform this step, producing SVG diagrams, but most editors are too fancy (most SVG editors) or too old (Draw.io) to perform this step cleanly.
I ended up sight-reading the diagrams into "Cloud Outliner" and produced an .opml file.
I discuss this process below.
Note that an automated transpiler would not need to use .opml files — we could go from .svg files directly,
but,
I want to show my thinking process in great detail. I was taught to "show my work for partial marks" in school. Doing this step manually is like showing my work or showing numeric division in longhand, or, …
I believe that it should be "obvious" how to build[1] a transpiler to alleviate most of this work.
(For the diagrams, see Prerequisites)
Prerequisites
https://guitarvydas.github.io/2021/05/09/Software-Components-101-Engine-Development-(Part-1).html
Roadmap
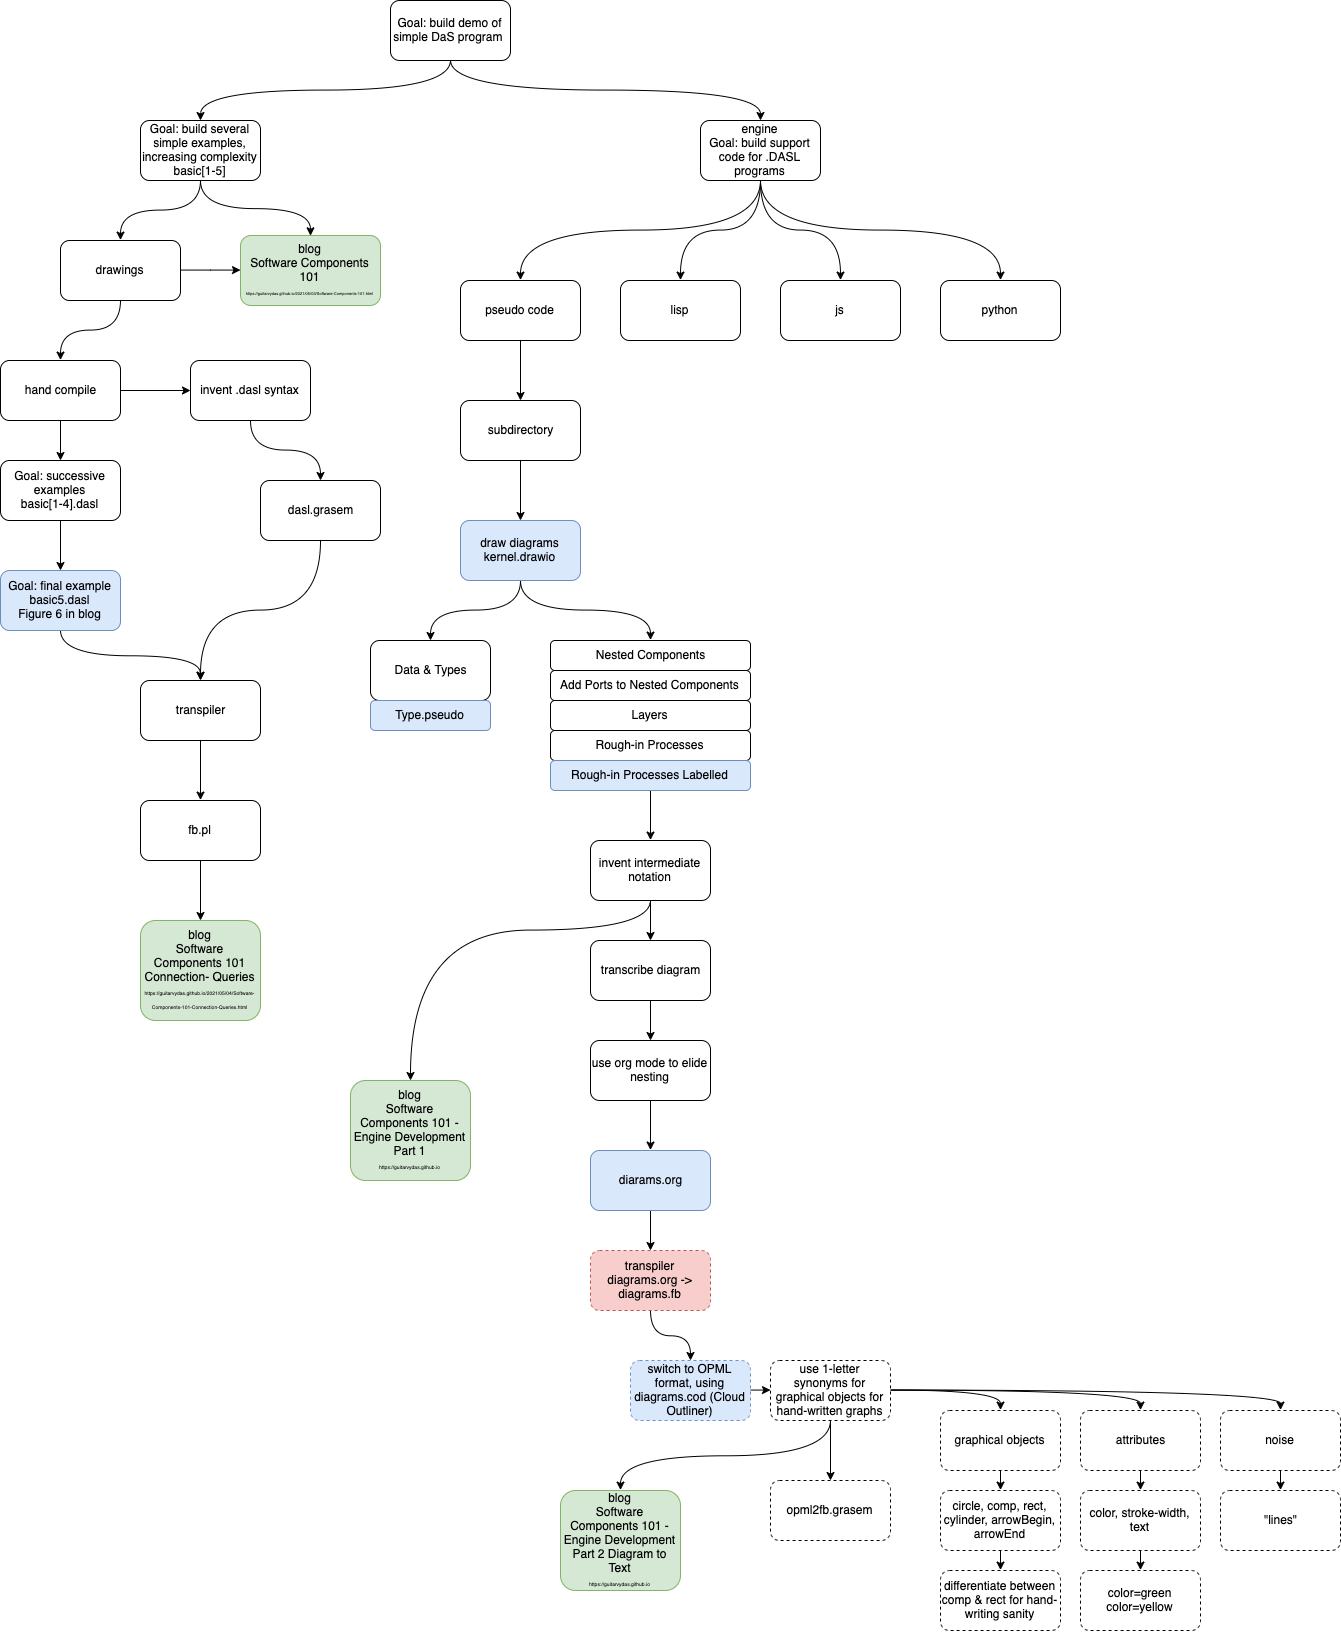
Cloud Outliner
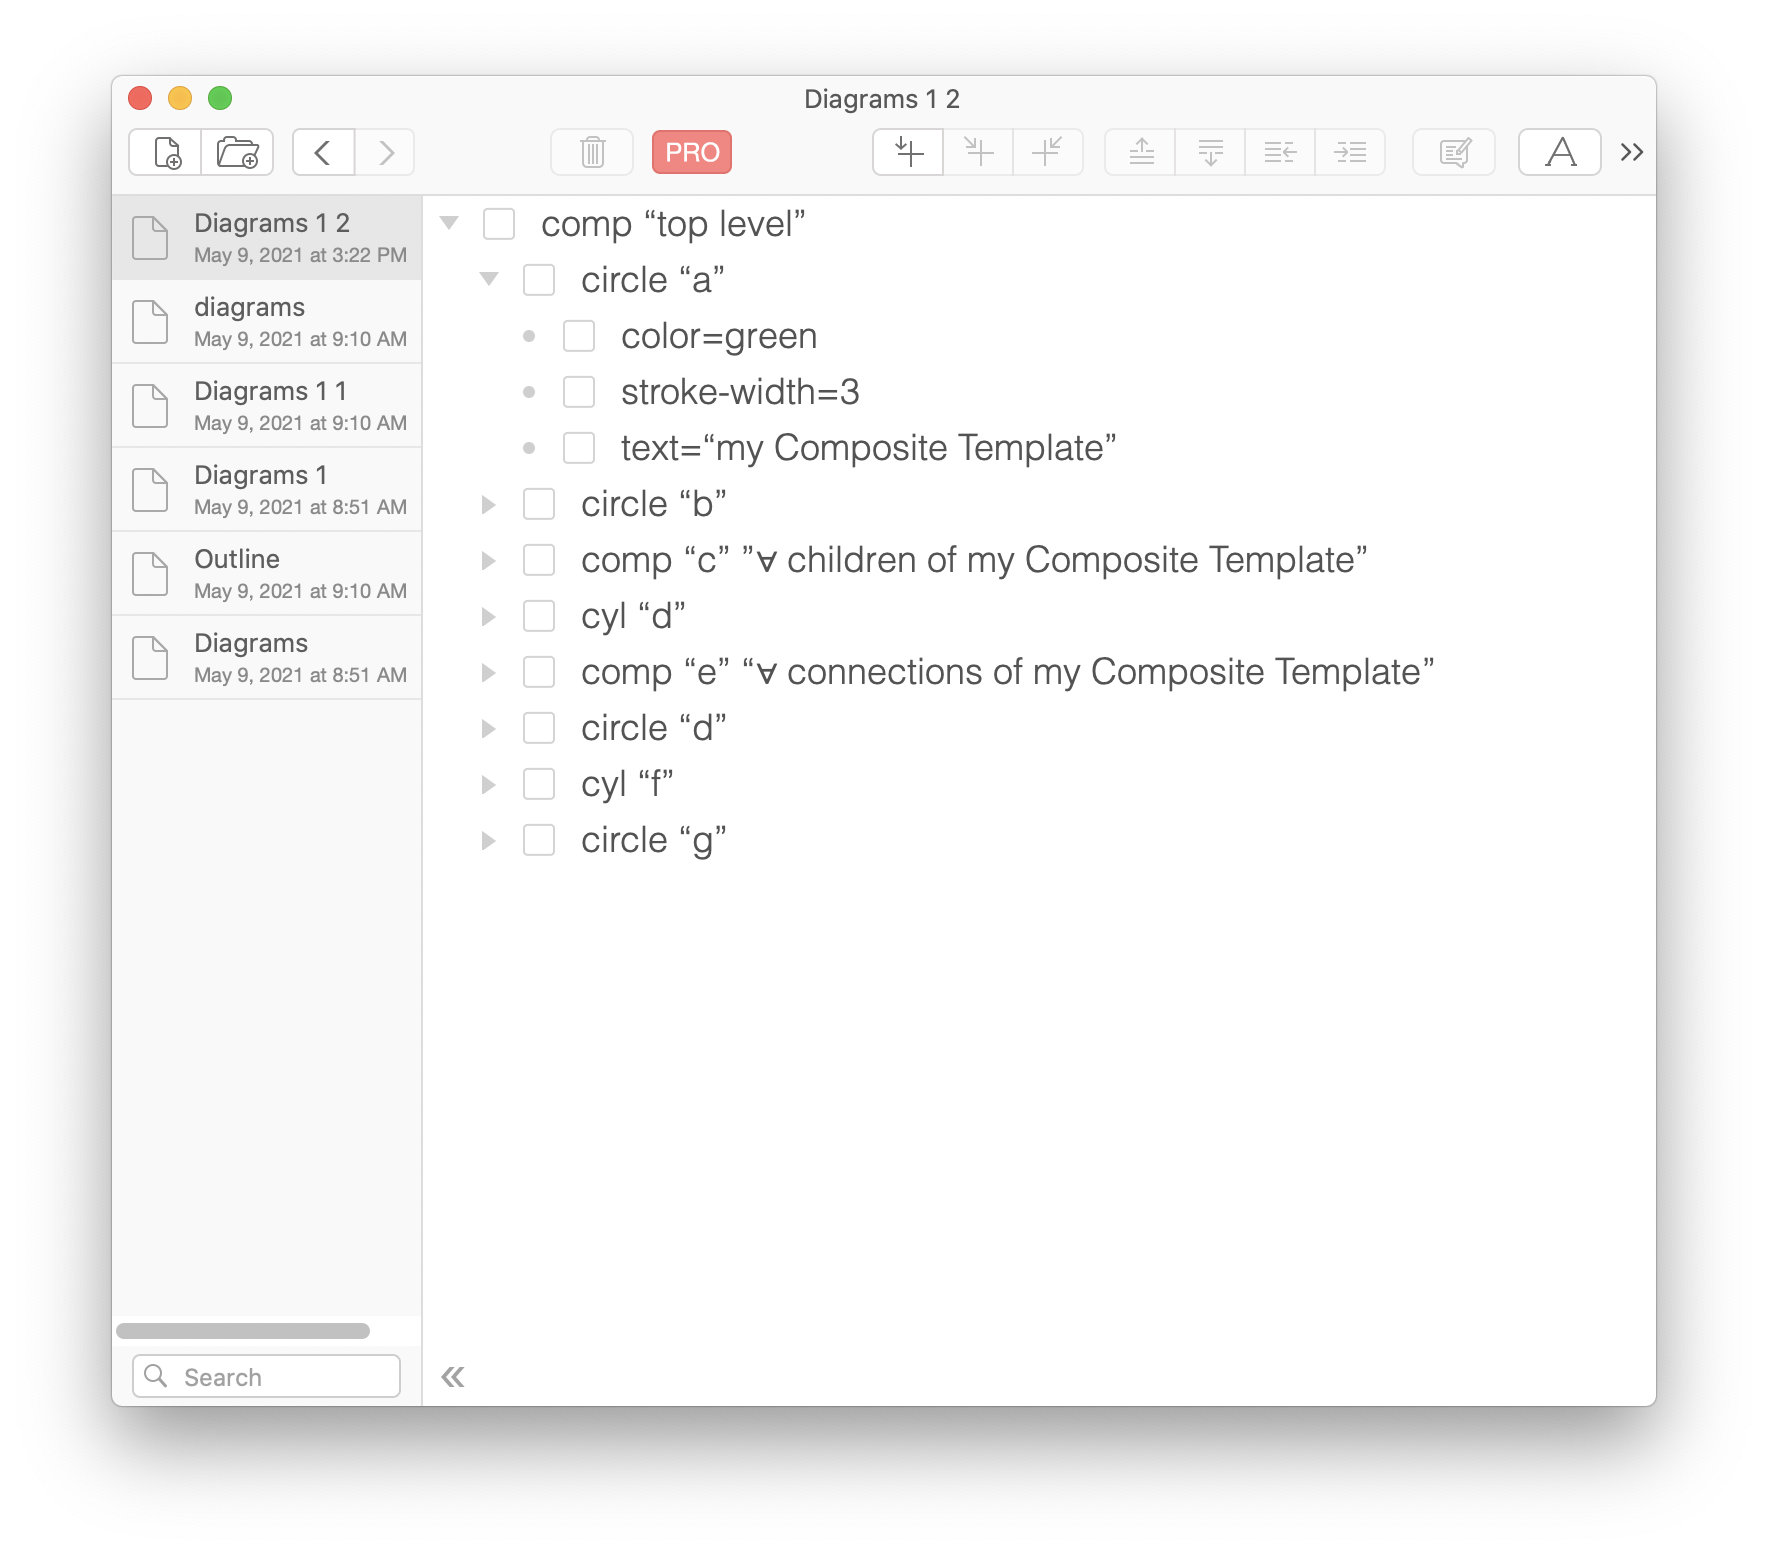
Fig. 1 Diagram in Cloud Outliner
I wanted to transcribe the diagram by hand, to show the thinking process.
There was so much "detail" (the .OPML file is 200 lines long) in the diagrams, that I searched for something less inconvenient to use. I tried raw text, then emacs .org mode, then SimpleMind and finally settled on Cloud Outliner.
Transpiling from a diagram to some kind of text (say, .SVG), should be easy and automated.
In the worst case, one can use one of the above tools and save the diagrams in .svg format, then perform post-processing[2]. A post-processed file can be further manipulated with PROLOG scripts or shell scripts. This was accomplished — a diagram transpiler consisting of some 40 components was built in Common Lisp (+ Holm PROLOG), but the number of steps[3] turned out to be a hindrance to rapid turn-around. I felt that something less complicated could be accomplished (this set of blogs indicates how to accomplish full transpilation).
I simply sight-read the diagrams into the tree-view.
The main diagrammatic objects are:
- rectangles
- circles
- lines (arrows)
- text.
Each object is annotated with appropriate attributes, such as color, etc.
The result is seen in Fig. 1. The full details can be seen in the github repo.
I allowed myself some conveniences. For example, instead of entering Components and Ports as rectangles, I entered Components as comp and Ports as rect.
I, also, allowed myself to tag interesting objects with single-letter tags instead of inventing and using full-blown IDs for each.
An automated transpiler would not need these conveniences but I, as a human, found it too error-prone to enter these diagrams in the most normalized (aka boring) manner.
OPML
The final OPML file is shown below.
A point to note is the extreme repetitive nature of the data — it is not "human readable" (except as a last resort), but, it is machine-readable. We only need the data to be in machine-readable format to further process it using scripts, Ohm-JS, PROLOG, etc.
Note that the diagrams are "human readable" but are not very readable when reduced to textual form.
Note, in passing, that it is possible to describe an architecture in diagrammatic form. The last step — converting the diagram to machine-readable form — can be performed by a scribe or by a suitable editor or by a set of scripts. The number of distinct kinds of elements is very small, but the normalized data is very boring from a human-readability perspective. "Boring" means error-prone when entered by humans. "Boring" means that automation can be applied.
<?xml version="1.0" encoding="UTF-8" ?>
<opml version="1.0">
<head>
<title>Diagrams 1</title>
<expansionState>0,22,26,71,73,86,89,92,123</expansionState>
</head>
<body>
<outline text="comp “A”">
<outline text="circle “a”">
<outline text="color=green" />
<outline text="stroke-width=3" />
<outline text="text=“my Composite Template”" />
</outline>
<outline text="circle “b”">
<outline text="color=green" />
<outline text="stroke-width=1" />
<outline text="text=“my runnable”" />
</outline>
<outline text="comp “c”">
<outline text="text=”∀ children of my Composite Template”" />
<outline text="circle “a”">
<outline text="color=green" />
<outline text="text=“my runnable”" />
</outline>
<outline text="circle “b”">
<outline text="color=green" />
<outline text="text=“my Composite Template”" />
</outline>
<outline text="circle “c”">
<outline text="color=green" />
<outline text="text=“child”" />
</outline>
<outline text="circle “d”">
<outline text="color=yellow" />
</outline>
<outline text="comp “e”">
<outline text="text=“make instance”" />
<outline text="rect “m”">
<outline text="color=green" />
</outline>
<outline text="rect “n”">
<outline text="color=yellow" />
</outline>
</outline>
<outline text="cyl “f”">
<outline text="text=“child instance”" />
</outline>
<outline text="comp “g”">
<outline text="text=”invent name”" />
<outline text="rect “o”">
<outline text="color=green" />
</outline>
<outline text="rect “p”">
<outline text="color=green" />
</outline>
<outline text="rect “q”">
<outline text="color=yellow" />
</outline>
</outline>
<outline text="cyl “h”">
<outline text="text=”named child instance”" />
</outline>
<outline text="comp “i”">
<outline text="text=“recursively instantiate”" />
<outline text="rect “r”">
<outline text="color=green" />
</outline>
<outline text="rect “s”">
<outline text="color=yellow" />
</outline>
</outline>
<outline text="cyl “j”">
<outline text="text=“filled child instance”" />
</outline>
<outline text="comp “k”">
<outline text="text=”insert child into children of my runnable”" />
<outline text="rect “t”">
<outline text="color=green" />
</outline>
<outline text="rect “u”">
<outline text="color=green" />
</outline>
<outline text="rect “v”">
<outline text="color=yellow" />
</outline>
</outline>
<outline text="cyl “l”">
<outline text="text=“my runnable filled in with children”" />
</outline>
<outline text="lines">
<outline text="arrow c m" />
<outline text="arrow n f" />
<outline text="arrow f o" />
<outline text="arrow b p" />
<outline text="arrow g h" />
<outline text="arrow h r" />
<outline text="arrow s j" />
<outline text="arrow j t" />
<outline text="arrow a u" />
<outline text="arrow v l" />
<outline text="arrow l d" />
</outline>
</outline>
<outline text="cyl “d”">
<outline text="text=“my runnable filled in with children”" />
</outline>
<outline text="comp “e”">
<outline text="text=“∀ connections of my Composite Template”" />
<outline text="circle “a”">
<outline text="color=green" />
<outline text="stroke-width=1" />
</outline>
<outline text="circle “b”">
<outline text="color=green" />
<outline text="stroke-width=1" />
</outline>
<outline text="circle “c”">
<outline text="color=green" />
<outline text="stroke-width=1" />
</outline>
<outline text="comp “e”">
<outline text="text=”clone connection”" />
<outline text="rect “k”">
<outline text="color=green" />
<outline text="stroke-width=1" />
</outline>
<outline text="rect “l”">
<outline text="color=green" />
<outline text="stroke-width=1" />
</outline>
<outline text="rect “m”">
<outline text="color=yellow" />
<outline text="stroke-width=1" />
</outline>
</outline>
<outline text="cyl “f”">
<outline text="text=“runnable connection with holes”" />
</outline>
<outline text="comp “g”">
<outline text="text=“fixup connection”" />
<outline text="rect “n”">
<outline text="color=green" />
<outline text="stroke-width=1" />
</outline>
<outline text="rect “o”">
<outline text="color=green" />
<outline text="stroke-width=1" />
</outline>
<outline text="rect “p”">
<outline text="color=yellow" />
<outline text="stroke-width=1" />
</outline>
</outline>
<outline text="cyl “h”">
<outline text="text=“fixed up connection”" />
</outline>
<outline text="comp “i”">
<outline text="text=”insert connection into runnable”" />
<outline text="rect “q”">
<outline text="color=green" />
<outline text="stroke-width=1" />
</outline>
<outline text="rect “r”">
<outline text="color=green" />
<outline text="stroke-width=1" />
</outline>
<outline text="rect “s”">
<outline text="color=yellow" />
<outline text="stroke-width=1" />
</outline>
</outline>
<outline text="cyl “j”">
<outline text="text=“final runnable”" />
</outline>
<outline text="lines">
<outline text="arrow c k" />
<outline text="arrow b l o" />
<outline text="arrow m f" />
<outline text="arrow f n" />
<outline text="arrow p h" />
<outline text="arrow h g" />
<outline text="arrow a r" />
<outline text="arrow s l" />
<outline text="arrow l d" />
</outline>
</outline>
<outline text="circle “d”">
<outline text="color=yellow" />
<outline text="stroke-width=1" />
</outline>
<outline text="cyl “f”">
<outline text="text=“runnable”" />
</outline>
<outline text="circle “g”">
<outline text="color=yellow" />
<outline text="stroke-width=1" />
</outline>
</outline>
</body>
</opml>
Further
In subsequent essays, I will show how
- to read the .OPML file using my grasem[4] tool,
- to convert the data into a factbase, (again, using grasem)
- to run search queries against the data — inferring semantically interesting information from the diagrams
- outputting code (that's: code transpiled from the diagrams), finally closing the loop.
[1] Hint: PEG / Ohm-JS and PROLOG would be my weapons of choice. I intend to do this explicitly in a future essay.
[2] This is done in the full-blown transpiler Arrowgrams, in Haskell and Lisp. See the code in https://github.com/bmfbp/bmfbp if you want all of the gory details.
[3] We used Draw.io to create diagrams, but needed to massage them and export them as .SVG files.
[4] https://guitarvydas.github.io/2021/04/11/Grasem.html