Parsing Diagrams - Connections
Diagram
Ports can be connected to one another.
[Only ports can be connected.]
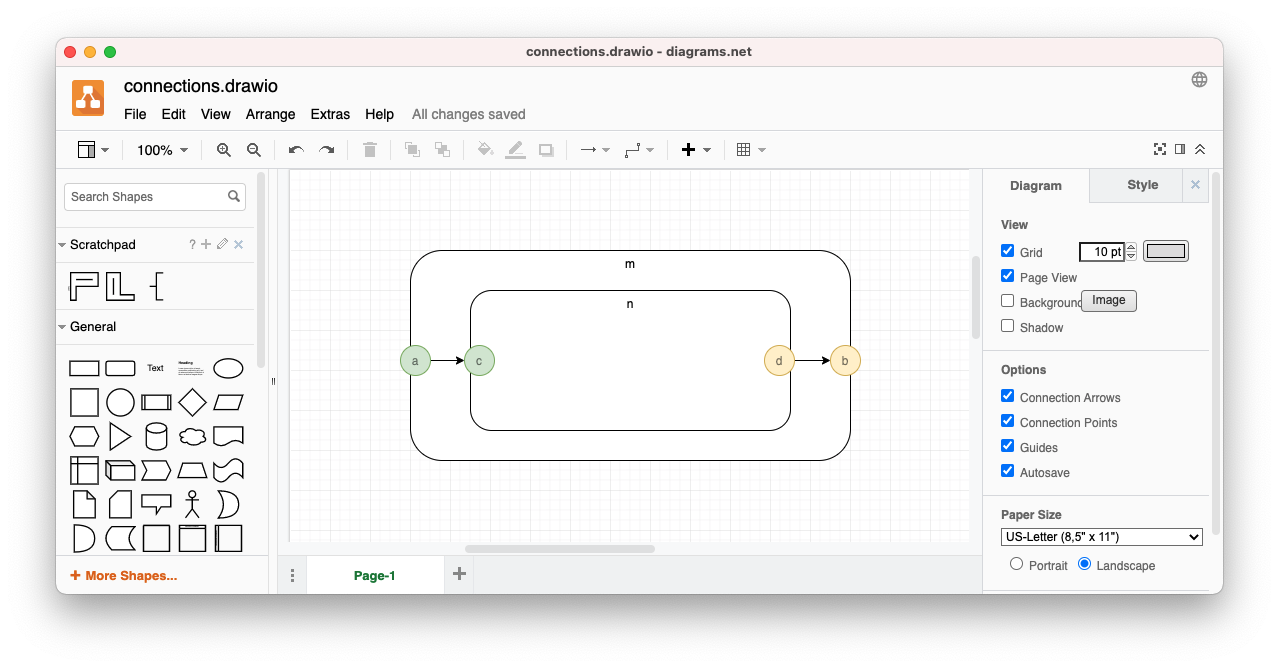
Connections are shown as arrows.
Connections appear in the factbase as 3 facts:
- A declaration, e.g.
edge(e,''). - A source port, e.g.
source(e,a). - A target port, e.g.
target(e,c).
Processing Connections
Edges as defined above need no further processing.
Later, we will tie edges to ports to components.
Drawio produces edge facts as mxCell nodes of the graph. We don’t need to do much more at this point.